In spite of increased buyer activity both online and in person, any substantial increase in sales failed to materialize this August.
Buyers showed lack of motivation to move on listings and for the most part, offers were made well below the list price. There were 53 sales across the Coast in August, only 1 more sale made than the same time last year. However with inventory 30% higher, at 555 properties for sale, the highest level since 2019, buyers have their choice of properties to choose from. Surprisingly, the amount of new listings brought to market so far this year is only 15% higher than January - August 2023. (1103 new listings brought to market so far, compared to 963 last year ), showing that a substantial amount of listings are taking longer to sell.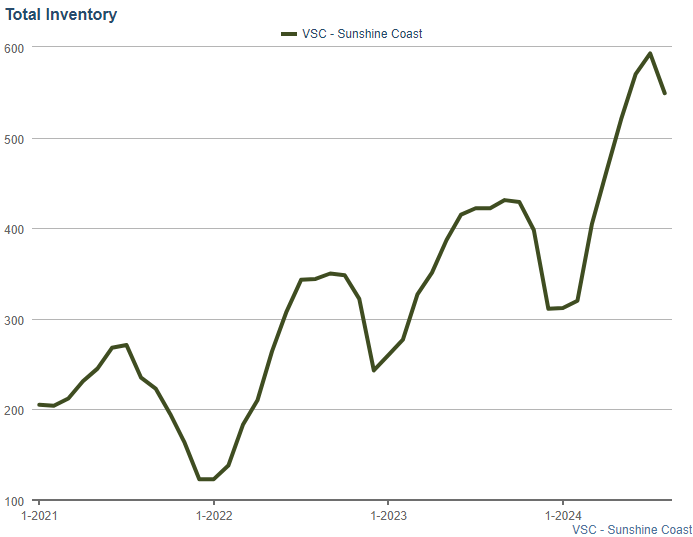
The current stats are showing that Average days on Market is 43. However, this number is derived from the most recent listings of the properties A deeper look shows that many of the properties sold this month were re-listed multiple times with some homes taking over 2 years to sell and price drops of 20% or more from their original list price. For example, in Halfmoon Bay, a waterfront home was originally listed at $2,599,000 in November 2022, it was re-listed over 4 times while reducing prices until finally selling for $1,390,000. In Gibsons, a family home was originally listed at $1,449,000 in March 2022 then was relisted 2 more times until relisted at $1,099,000 this August, where it sold in 8 days at the new full list price. While these are more extreme examples, they do illustrate how pricing aggressively in a buyers market, creates a much longer time on market and ultimately ends up causing much greater price reductions.
Current market conditions across the Coast show that buyers are still in the driver's seat. While interest rates have decreased and buyer interest has continued to show increased activity, we also consider the months of inventory on the market ( How many months would it take to sell all the listings based on current sales). Typically a market with 3-6 months of inventory shows stable prices, while anything over 6 months, tends to cause downwards price adjustments.
Gibsons: Listings: 142 (+5%) | Sales: 11 (-38.9%) | Months of Inventory: 12.9
Roberts Creek: Listings: 38 (+2.7%) | Sales: 4 (+33%) | Months of Inventory: 10
Sechelt: Listings: 193 (+48.5%) | Sales: 22 (+37.5%) | Months of Inventory: 8.8
Halfmoon Bay: Listings: 64 (+64.1%) | Sales: 9 (+12.5%) | Months of Inventory: 7.1
Pender Harbour: Listings: 89 (+29%) | Sales: 5 (-28.6%) | Months of Inventory: 17.8
Given the varied levels of competition across different areas on the Sunshine Coast, it's crucial for sellers to recognize that each type of home may face different market dynamics. Understanding the months of inventory in your specific market and property type can help shape a pricing strategy that maximizes your sale price while avoiding the risk of chasing a down market. Homes in areas with higher months of inventory are more likely to see downward price pressure, which can actually present a great opportunity for those looking to move up to a bigger or more expensive home. Since the discount on higher-priced properties could be greater, you may find yourself in a better position to upgrade while taking advantage of favorable market conditions.
For personalized advice on how to make the most of this market, give us a call. We'll help you set a competitive price for your current home and guide you through your next steps, ensuring you get the best possible outcome on both ends of the deal.